
One of the tools provided with Visual Studio 2005 is the Script Explorer. This tool can be used to view all the JavaScript that have been loaded so far, accessing the functions and objects and debug the script simply by using breakpoints.
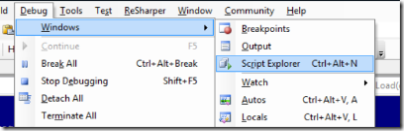
You can use it when you are debug mode in Visual Studio:
The script explorer looks like this:
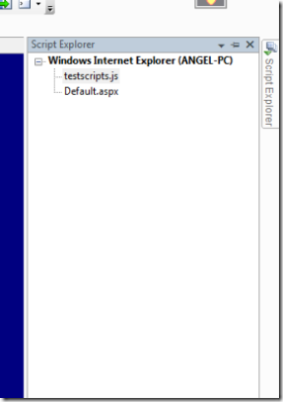
You can see the pages that have been loaded so far and the script files. Here you can see I have a JavaScript file named testscripts.js that already have been loaded.
Clicking on the script will display it in VS were you can set breakpoints on the code and debug it.
In order to debug scripts that are written in the page itself you need to click the page in which you want to debug in the script explorer (NOT the solution explorer). The page that will be open is the page after the server have rendered it. Then you simply add a breakpoint on the line of script you want to debug.
You can read more about the script explorer in MSDN
Remember: Before you can debug scripts you need to clear the disable script debugging checkbox under your browser (In IE: Internet Options -> Advanced -> Browsing -> Disable script debugging (Internet explorer).